How to Debug Your Website Fast
Debug website fast: logging, debug tools, and production observability. Find and fix bugs in WordPress, Laravel, and JavaScript with AI in the loop.
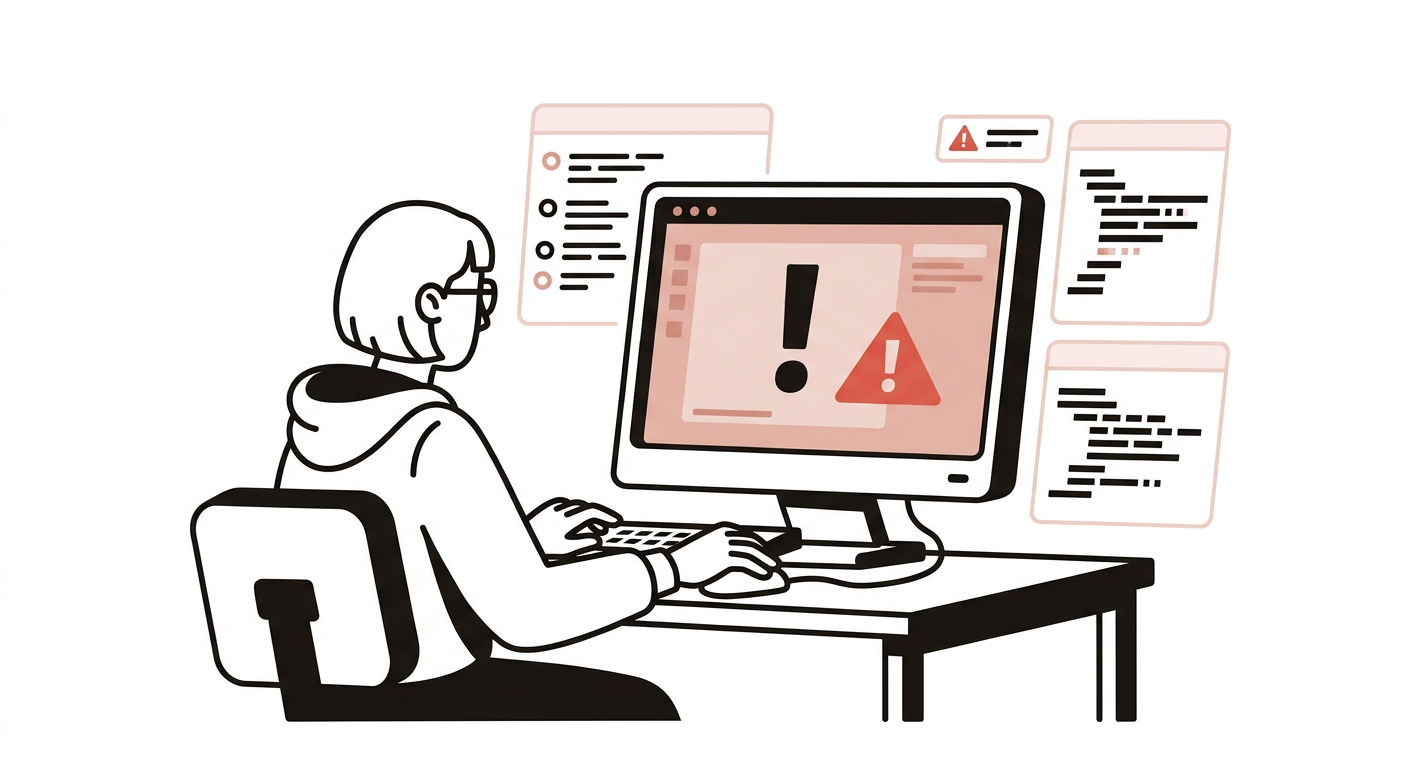
Have you ever been mid-panic trying to fix a production website that refuses to tell you what’s wrong?
You’re staring at a screen full of “500 Internal Server Error”, a generic “Website is down” page, or the notorious White Screen of Death (WSOD). No stack trace, no clue where to start.
Whether you’re a beginner or a pro, it happens to all of us. Mistakes are inevitable — and AI models aren’t immune either.
The good news: you can debug your website fast even when it’s not being helpful. The trick is to make your website explain itself.
That’s what observability is — designing your site so you can ask it questions when things go wrong, instead of redeploying with var_dump() in a random spot and hoping.
What is observability
Observability is the practice of designing systems so you can answer unknown questions about their internal state from the outside — using the data they emit (logs, metrics, traces) without having to guess or redeploy.
It’s different from just monitoring. Monitoring tells you “this is broken” — known failures, like “disk at 90%”. Observability lets you figure out why it’s broken — unknown failures — by asking new questions on the fly. You don’t have to predict every failure in advance; you just make sure the site keeps receipts.
How to add observability to your website
There are a number of practices and observability tools you can add to your website to understand it from every angle. For the sake of practicality, I’ll stick to what I actually use for client websites — nothing that requires a dedicated SRE team.
1. Basic and manual logging
Logs help you understand how your website behaves, including the unobvious stuff — the order things ran, what a variable actually held, which request path a job took.
There are multiple ways to add basic logs to your website. The most common are console logs in JavaScript and manually printing variables in PHP while debugging locally. On a live site — production or staging — be careful not to expose sensitive information.
JavaScript console.log()
I use console.log() all the time to debug JS on client websites: understanding DOM manipulation behavior, tracing script timings, and troubleshooting single page applications (SPA).
Here’s a basic example:
console.info("App started at", new Date().toISOString());

const name = "Rol";

if (name !== "Pai") {
  console.error("Hey, you're not Pai!");
} else {
  console.log("Welcome back", name);
}
When working with asynchronous JavaScript, console.log() is especially helpful to trace the timing of your scripts.
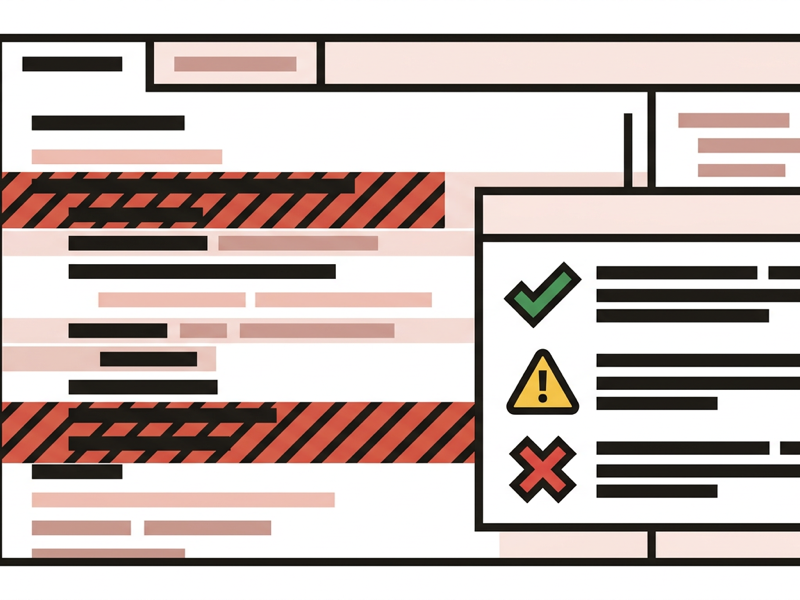
In one client website I was working on, getting the consent banner script and Google Tag Manager timing right is crucial for setting up funnels and tracking. Adding logs inside and outside functions helped me debug faster by tracing execution phases.
WordPress debug logs
When working on a custom WordPress plugin or function, printing variables on the page helps you understand what’s being processed.
For example, you can use echo and var_dump() to inspect a WordPress post object’s data — post count, and what fields each post object contains:
$args = array(
  'post_type'      => 'portfolio',
  'posts_per_page' => 4,
  'post_status'    => 'publish',
  'orderby'        => 'date',
  'order'          => 'DESC',
);

$the_query = new WP_Query( $args );

echo '<pre>';
echo '<strong>$the_query->post_count:</strong> ' . intval( $the_query->post_count ) . "\n\n";
var_dump( $the_query->posts ); // array of WP_Post objects
echo '</pre>';2. Website observability tools in development
These tools — also called debugging tools — let you inspect the internals of a website while you work on it. Without them you’re developing blind. Imagine trying to figure out what’s wrong with a website using only your phone.
Debugging tools are widely available for both front-end and backend.
Front-end tools
When dealing with the front-end, a few tools cover most situations:
- Browser console: where
console.log()outputs its messages. - Chrome DevTools: the bundled inspector for elements, network requests, and JavaScript. Breakpoints beat logging when you need to freeze execution and inspect state at a specific moment.
- React Developer Tools: inspect component props, state, and hooks in React apps without scattering logs everywhere.
Backend tools
If you’re dealing with WSOD or server error 500s, your first stop is the server’s error logs and PHP error logs. WordPress has debugging built in, but it needs to be enabled manually in wp-config.php:
define( 'WP_DEBUG', true ); // Turns on WP's error reporting.
define( 'WP_DEBUG_LOG', true ); // Writes errors to debug.log
define( 'WP_DEBUG_DISPLAY', false ); // set to false so errors don't print on the page
However, checking those files manually isn’t practical — especially if you’re not comfortable with a terminal. (You should get comfortable with one eventually; it’s the fastest way into most servers.)
What you can do instead is install a debugging tool while in development:
- WP Query Monitor: a debugging panel for WordPress that shows database queries, hooks, PHP errors, and which template file rendered the page.
- Laravel Debugbar: the Laravel equivalent — queries, timing, session data, and logs in a handy bar at the bottom of the page.
- Node Inspector: a debugger for Node.js apps. Combined with
node --inspect, it gives you Chrome DevTools-level breakpoints on the server side.
These tools let you inspect backend internals without the friction of manually checking logs on the server.
For example, on a Laravel project I can see exactly what queries the database ran and how long each took, then optimize the slow ones to cut load times. On a WordPress site, I can see what template is being used on a page and what kind of page it is by checking the conditional template tags: is_front_page(), is_page(), is_singular().
3. Production observability
So far we’ve only covered tools that work in development. The moment a client’s website ships, we lose most of that visibility — which is correct. We don’t want the public poking at the internals.
“I shipped the site with no bugs on testing, I got paid, the work is done, right?”
No.
This is where most beginners and founders get it wrong: the work never stops for either party. We’re not making and selling pancakes — we’re building intricate, sometimes delicate systems that need constant maintenance and monitoring.
I can’t stress enough how important maintenance is. It’s the backbone of a reliable website. It’s how I keep client sites running smoothly for years after launch.
Observability tools for production
Now that the website is public and handling real traffic, observability matters more. It’s how you understand why a site behaves differently for some users — instead of dismissing it with “it works on my machine.”
Tools I use on production:
- Axiom: log storage built for the web. You send it structured logs from your app (or ingest Cloudflare logs) and query them instantly, no infrastructure to run.
- Cloudflare: network-level observability for sites behind its edge — analytics on requests, errors, and performance, plus the live traffic view that shows a failure as it happens.
- Sentry: error tracking with full stack traces. I use it on Laravel and WordPress sites; every exception arrives as a readable report with the file, line, and the user’s path to the bug.

Debugging faster with AI
Once observability is set up, AI can make debugging a lot faster. Here are the workflows I actually use:
1. Let AI set up manual logging while in development
When working heavily on the front-end — building charts, dynamic web apps — prompt your AI agent to create comprehensive console logging that both you and the agent can consume later when debugging.
It saves time and tokens to set this up once. AI agents will add temporary logs on the fly while troubleshooting anyway, but a first-time setup prevents it from recreating throwaway debugging scripts every session.
2. Debug faster with debugging tools
AI agents can reason from your context alone, but if you want better answers and lower token costs, give them tools to see the problem directly:
- Playwright: give your agent access so it can run and click through a real browser, reproducing the bug step by step.
- Chrome DevTools MCP: connect it to Chrome DevTools so it can inspect elements, network requests, and console output live.
- Third-party tools: with DevTools access, it can also read what WP Query Monitor and Laravel Debugbar expose on the page.
If you’re comparing AI coding tools for client work, I’ve written about which setup is cheapest for the money — worth a read if you plan to lean on agents for this.
3. Let AI analyze your production observability data
As I mentioned, the development tools don’t follow you into production. But if you set up production observability, you can let your AI agent query that data through the service’s MCP (where available) and analyze it for you.
A real example: I built a booking web app with Astro that connects to Acuity Scheduling and Beam Checkout. Users kept complaining about errors after paying — sure enough, their appointments never made it into Acuity.
Testing end-to-end and refactoring in development didn’t surface it, because the bug lived in rare edge cases: a mobile payment method’s behavior, and the time gap between booking and payment causing race conditions. No amount of code reading would have found it.
The AI agent produced a conclusive analysis from the Axiom logs it had set up for itself, and we fixed the bugs from there. Without observability in production, we’d still be guessing.
The bottom line
Nobody debugs their way out of a broken website by staring harder. The fix is boring and mechanical: logs in development, debug tools while you build, and observability once it’s live. That three-layer setup is what turns a midnight panic into a 10-minute fix.
Then add AI on top — agents that log for you, read the DevTools, and query production data. Each layer shaves a little more time off the same old problems.
Start with one thing today: if you have a WordPress site, enable WP_DEBUG_LOG. If you build Laravel, install Debugbar. If it’s already live, create a Sentry account and send errors to it. Do that before you need it, and you’ll never have to debug blind again.
More articles on keeping websites healthy live in the maintain hub.
Frequently asked questions
How do I debug a website fast?
Build observability in from the start: console logs in JavaScript, WP_DEBUG in WordPress, and a tool like Laravel Debugbar in development. In production, ship logs and errors to Sentry or Axiom so the site tells you what broke. Then let an AI agent read that data instead of guessing.
What is the fastest way to find a bug on a production website?
You can't debug what you can't see. Production observability tools like Sentry capture stack traces the moment errors happen, Axiom stores structured logs for querying, and Cloudflare shows network-level failures. Together they turn a 500 error into a named file and line number within minutes.
How can AI help with debugging?
Give your AI agent the same tools you use: Playwright to reproduce the bug in a real browser, Chrome DevTools MCP to inspect elements, and an observability service's MCP so it can query your production logs. A good prompt with real error data beats an agent guessing from memory.
What are the best observability tools for websites?
For development, WP Query Monitor, Laravel Debugbar, and Node Inspector. For production, Sentry for errors and stack traces, Axiom for structured logging, and Cloudflare for network and performance. Start with one logging tool and one error tracker, then add more as you need them.

Keep reading
Cursor vs Claude Code vs Windsurf: Which AI Tool Actually Ships Client Work?
Cursor vs Claude Code vs Windsurf: an honest comparison for freelancers. Discover which AI coding tool actually ships production client work in 2026.
Coolify on Hetzner vs Cloudways: The $5/mo VPS vs Managed Cloud for Client Sites
Coolify on Hetzner vs Cloudways: an honest cost and ops breakdown. $5/mo self-hosted VPS vs managed cloud for client sites, and when self-hosting bites.
Comments